
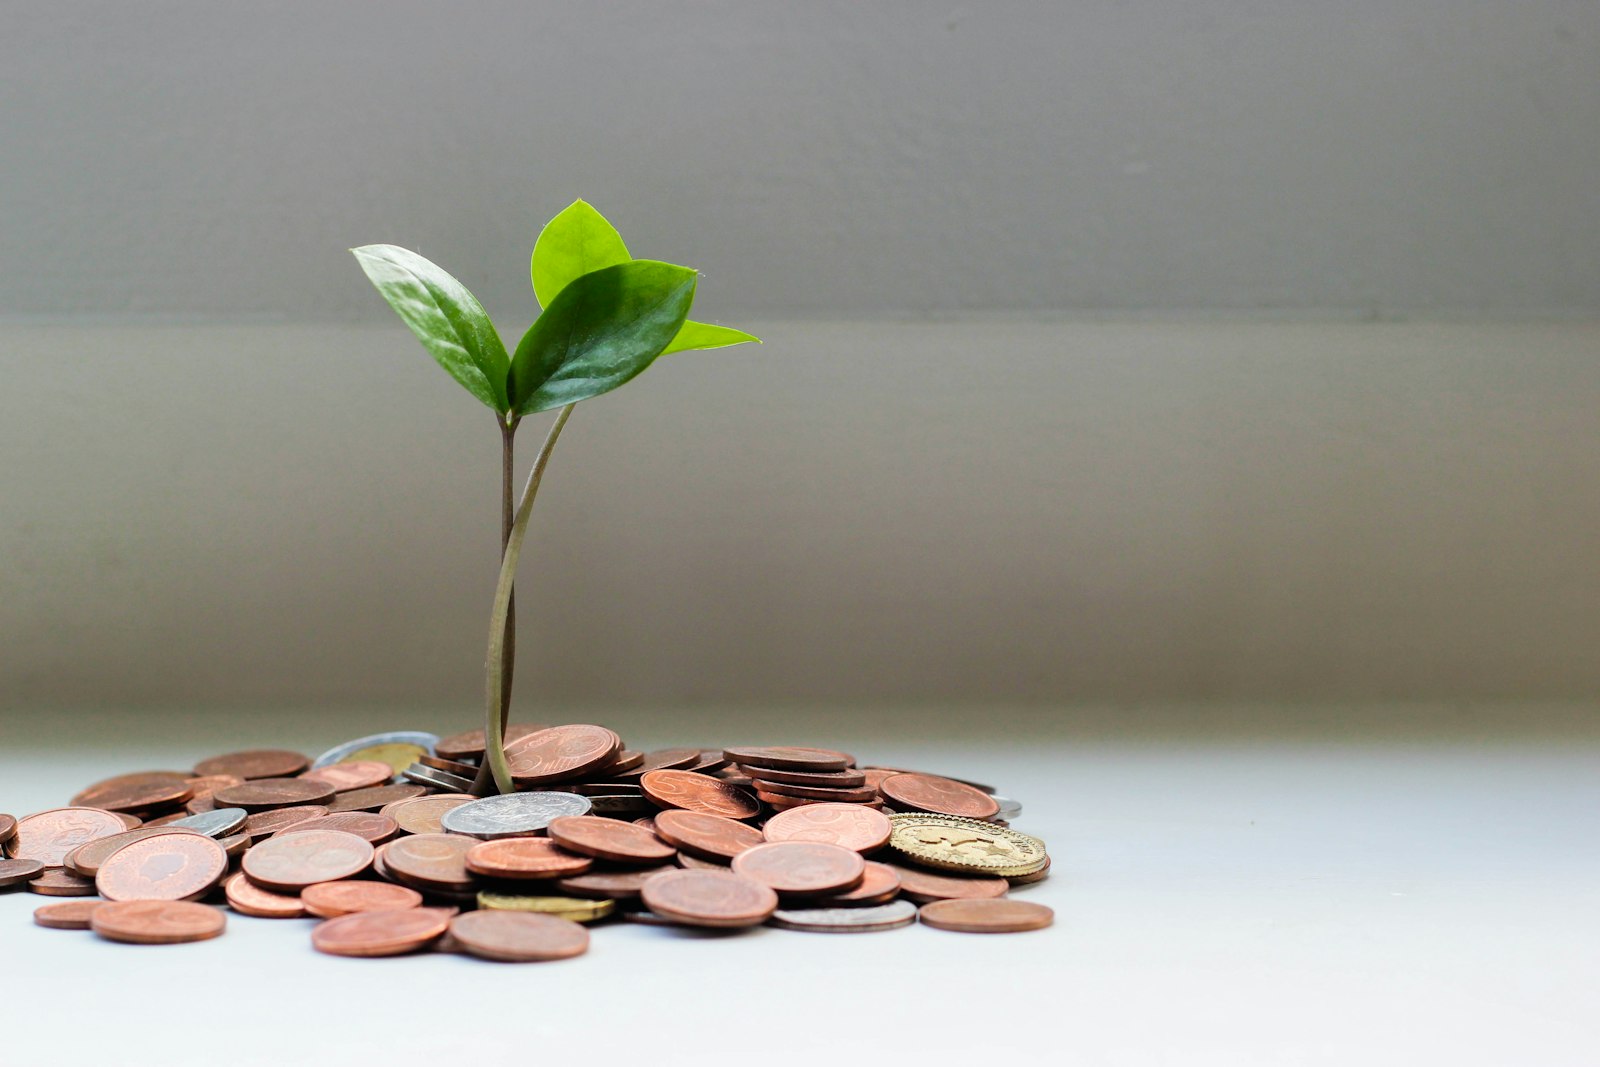
Where My Money Actually Goes — A Brutally Honest Category Breakdown
I have been tracking my own money in some form for about seven years. I have read approximately a hundred personal finance books. I write about money for a living. By any reasonable measure, I should know where my money goes.
I did not know where my money goes. Not really. Not in the kind of detail that would let me describe it accurately to a stranger. I had a vague sense that I spent a fair amount on food, less than I used to on subscriptions, and somewhere in the range of "more than I'd like" on Amazon. That was about it.
In January of this year I sat down with twelve months of statements from every account — checking, two credit cards, PayPal — and went through every single transaction. I categorized everything. I added it up. I made a spreadsheet that, for once, I actually finished.
Some of what I found was exactly what I expected. Some of it was so different from my mental model that I had to triple-check the math. I want to walk through the categories honestly, because I think the gap between what we think we spend and what we actually spend is genuinely surprising for almost everyone.
The Setup
For context: I was earning about $63,400 last year, which after taxes, health insurance, and pension contributions came to roughly $46,000 take-home. That's $3,830 a month. I live in Portland with my partner, who pays half of housing and utilities and otherwise has separate finances.

Total spending in the calendar year, across all accounts: $44,820. I was rounding net positive by about $1,200 across the year, almost all of which was a tax refund I just hadn't moved to savings yet.
So far, so unremarkable. The interesting part is the breakdown.
Housing — $14,400 (32%)
My rent share is $1,100 per month and my utilities and internet share is roughly $100 a month, so housing was $14,400 for the year.
This number was not surprising. Housing is the easiest category to know in advance because it's the same number twelve times.
What did surprise me, slightly, is that housing was a smaller share of my total spending than I'd assumed. The "rent should be no more than 30% of gross income" rule put my housing at almost exactly 28% of gross — well within standard guidance. The 32% of net spending sounded high but is actually below the median for renters in most major US cities right now.
Groceries — $5,640 (12.6%)
I spent $5,640 on groceries last year. That's $470 a month for one person eating mostly at home, in a moderate-cost-of-living city.

For most of the year I thought we were spending about $400 a month on my share of groceries. Wrong by 18%. The gap turned out to be a single-person Costco membership I'd added in March that I'd been forgetting to factor in — I'd been splitting Trader Joe's runs with my partner but doing Costco runs solo, and the Costco trips were averaging $90 each, monthly, that I had not been counting.
This is, I think, the most common spending miscalculation I see in friends. People know what they spend at their main grocery store, and they forget about the secondary stores. Costco, the Asian grocery, the bakery, the convenience store run for milk on a Tuesday. These add up considerably and never appear in the mental model.
Restaurants and Takeout — $3,120 (7%)
This was the category that made me close the spreadsheet for an hour and go for a walk.
I would have told you, before opening the statements, that I spent maybe $1,500 a year on restaurants and takeout. I am extremely careful about eating out. I cook at home most nights. I am, in my own self-perception, a person who does not spend much money eating out.
The actual number was $3,120. Two times what I thought.
The math, broken down: about 32 sit-down restaurant meals across the year, averaging $44 (drinks included). 41 takeout orders averaging $28. About 18 lunches at work, mostly when I forgot to bring food, averaging $14. Plus assorted small items — the $4 muffin, the $7 smoothie — that came to maybe $200 across the year.
What this taught me, more than anything specific, was that the meals I think of as "occasional" are actually weekly. I would have told you I get takeout maybe twice a month. The actual rate was almost once a week.
Transportation — $2,840 (6.3%)
This was on the higher end of what I expected. I drive a 2017 Honda Civic that's paid off. So my transport costs are gas (about $1,200), insurance (about $900), one major repair last year ($410), oil changes and minor maintenance (about $200), and parking and tolls ($130).
Insurance is the variable I most regretted not addressing earlier. The $900 was the auto-renewed price from State Farm, and when I finally shopped it in November, I got the same coverage from Progressive for $640 a year. So next year this category will be about $260 lower without me changing anything else.
Shopping (Non-Grocery) — $2,210 (5%)
This is the umbrella category for clothing, household goods, gifts, and the dreaded "Amazon" line item.
The breakdown was: clothes $480 (which felt about right). Household goods $360 (cleaning supplies, sheets, a new pillow, kitchen things). Gifts $410 (birthdays, the holidays, two weddings, a baby shower). Amazon-other $560 (this is the embarrassing one — the cumulative pile of small Amazon purchases that don't fit any other category, like phone cases and cable organizers and that one weighted blanket that turned out to be too heavy). And miscellaneous in-person retail $400.
The Amazon number, broken into individual purchases, was astonishing. 47 separate orders across the year, with an average of about $12 each. Most of them were things I'd entirely forgotten purchasing within a week.
Health and Personal Care — $1,890 (4.2%)
This was higher than I'd expected, mostly because of one thing I'd been mentally categorizing wrong. My therapy sessions, which I've been doing weekly since 2022, came to $1,200 of that total. (Sliding scale, $25 per session, 48 sessions in the year.) I'd been thinking of therapy as a fixed bill rather than a discretionary expense, but technically I have been paying out of pocket.
The rest was: gym membership ($420), haircuts ($180), pharmacy and toiletries (about $90).
I am keeping all of these. This is the category I look at and feel basically fine.
Subscriptions and Services — $1,140 (2.5%)
I expected this number to be much higher than it was, which was a pleasant surprise. The breakdown: Netflix ($179), Spotify ($131), Adobe Creative Cloud ($240 — for the Etsy work), Canva Pro ($156), iCloud ($36), New York Times subscription ($175), one news subscription I've already canceled ($120), and Audible ($104).
I went through this list and only canceled the news subscription. Everything else I'm actively using. This was the one category where the audit confirmed my decisions rather than challenging them.
Travel — $1,420 (3.2%)
I took two real trips last year — a long weekend in Bend with friends and a week visiting my mom in Detroit. Total spending across both: $1,420. This was less than I'd expected because I had stayed at family or with friends both times rather than paying for hotels.
I am content with this number and would happily double it next year if the right trips come up.
Entertainment — $640 (1.4%)
Concerts, the occasional movie, two books I bought instead of borrowing from the library, and a Steam game I bought on sale and haven't played. Reasonable.
"Other" — $1,520 (3.4%)
The catch-all category for things that didn't fit anywhere else. Therapy copays before I switched providers, one parking ticket, a small charitable donation, the renewal of my passport, a state ID replacement after I lost mine in May. Not interesting individually, but they add up.
What the Audit Changed
The total category breakdown is roughly:
- 32% housing
- 13% groceries
- 7% restaurants
- 6% transport
- 5% shopping
- 4% health
- 3% travel
- 3% subscriptions
- 1% entertainment
- The rest split between savings, taxes I'd already withheld, and miscellaneous
I made three changes after this audit, and only three.
One: I switched my car insurance, saving $260 a year.
Two: I deleted the Amazon app from my phone for sixty days as an experiment. The 47 orders had been driven significantly by the convenience of the app being on my home screen. Forcing myself to log in via a browser cut my Amazon orders to 9 in the next sixty-day period.
Three: I made one rule about restaurants: any sit-down meal over $40 has to be a deliberate choice, planned at least a day in advance. The spontaneous "let's just grab dinner" purchases at 7 PM on a Wednesday were, I realized, the bulk of the restaurant overspend, and they were rarely the meals I actually enjoyed.
Total annual savings from these three changes, projecting forward: about $1,400.
That's not life-changing. It's also $1,400 I now have for things I value more, and it required no ongoing discipline. Three structural changes, each one applied once.
What I'd Tell You
If you've never done a full year-end audit, this is the single most useful thing you can do for your finances in a weekend.
Pull twelve months of statements. Categorize every transaction — not into 23 categories, into about 10. Add it up. Compare it to what you would have guessed.
The gaps between what you think you spend and what you actually spend will be larger than you expect. They were for me, and I had been writing about money for years.
The point isn't to feel bad about the gap. The point is that you can't change what you don't see. The audit is the seeing. Everything after it is easier.

Written by
Sarah Chen
Sarah paid off $52,000 in student loans, reached financial independence at 41, and now writes about the real-world money decisions that actually move the needle. She's based in Portland, Oregon and still tracks every dollar.
More about SarahYou Might Also Like

How Payday Loans Actually Work (And Why the Math Is Far Worse Than It Looks)
A payday loan for $300 that costs $45 to borrow sounds manageable. Run the math and that fee is equivalent to a 391% annual interest rate. Here is exactly how these loans work, why so many people get trapped, and what to do instead.
The Month I Stopped Living Paycheck to Paycheck (It Wasn't a Raise That Fixed It)
I made a decent salary and had nothing left three days before payday every month. This is the exact sequence of changes that broke the cycle — and why the thing that actually worked wasn't what I expected.

Giving My Kid $5 a Week Quietly Fixed a Hole in My Own Budget
I started my son's $5 weekly allowance to teach him about money. Watching him agonize about a $24 toy exposed a spending habit I'd long hidden from myself.